Two modes(Beta)
MemSage 1.0.0 is the first release of our CPU and GPU memory diagnostics tool. It finds memory problems in Python programs and PyTorch training jobs, and it works in two modes.
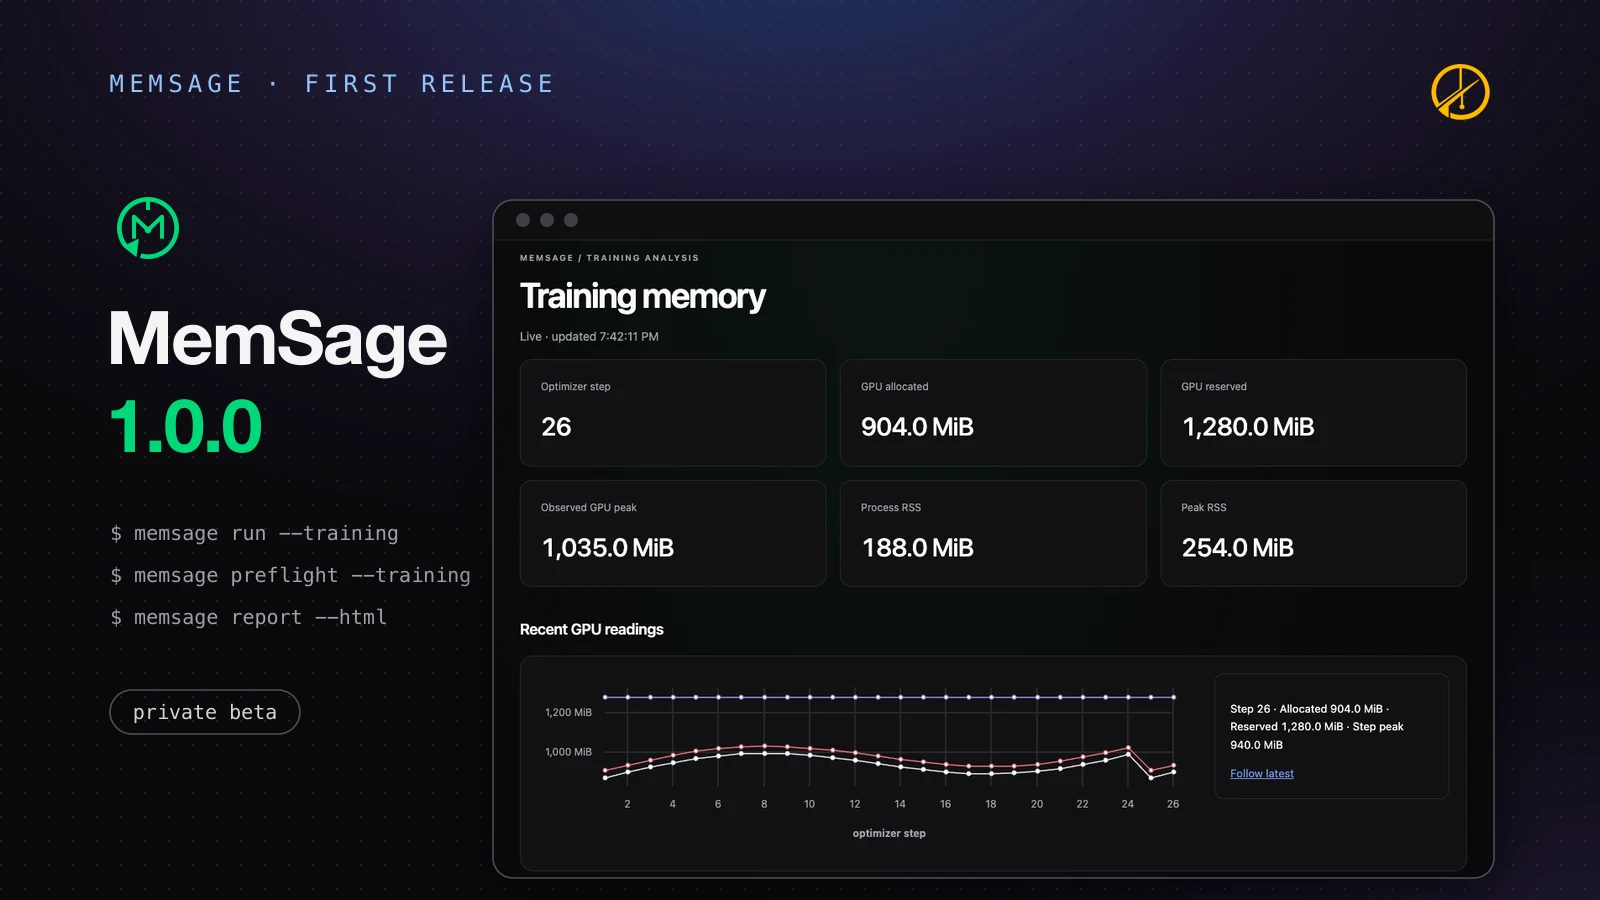
memsage run (run --training for training jobs) watches a program or a training job while it runs. It detects memory leaks that grow steadily and names the code that allocated the surviving memory and what still holds it; it shows the peak GPU memory usage by step and by category; and it records out-of-memory kills. With memsage run --training --command -- torchrun ... it watches every rank of a multi-node job, one MemSage per node, and memsage report reads the hosts' directories as one job.
memsage preflight --training checks a job before it is run at scale: it records every memory allocation and checks the job for misconfigurations.
memsage report DIR prints the report of a run or preflight directory; --html FILE writes it as an HTML page.
Where it stands
1.0.0 is the build the team runs on its own workloads. MemSage is in private beta: request access with your framework and versions, and we will discuss compatibility and setup for your workload before you begin. Two recorded demos are on the Resources page.
Source: the MemSage 1.0.0 release notes, November 1, 2026.