01
Continuous monitoring
Follow CPU and GPU memory usage during training and inference. Investigate growth and peak usage that may indicate leaks or inefficient resource use.
Products
MemSage helps AI teams understand CPU and GPU memory usage, identify leaks and inefficiencies, and diagnose out-of-memory failures during training and inference. It is designed around three workflows: continuous monitoring, preflight checks, and on-demand diagnosis. Its preflight checks can help identify configuration issues that can cause memory failures, inefficient resource use, and wasted GPU time. By connecting memory growth and peak usage to relevant allocations, tensors, and call stacks, MemSage helps developers identify causes and opportunities for optimization—reducing debugging effort and improving GPU efficiency.
Use memory evidence before a job starts, as it runs, and when a failure needs investigation.
01
Follow CPU and GPU memory usage during training and inference. Investigate growth and peak usage that may indicate leaks or inefficient resource use.
02
Review memory and configuration risks before a longer job. Checks can help identify setups that may cause memory failures or waste GPU time.
03
Investigate an OOM failure or unexpected memory behavior by connecting it to relevant allocations, tensors, and call stacks.
Preflight checks can help identify configuration issues that may cause memory failures or inefficient resource use before a longer training job.
Investigate memory growth and peaks across CPU and GPU with allocation, tensor, and call-stack context.
Explore the report pages you will use to investigate a workload, from the first memory reading to the allocation that needs attention.
Reports & ranks
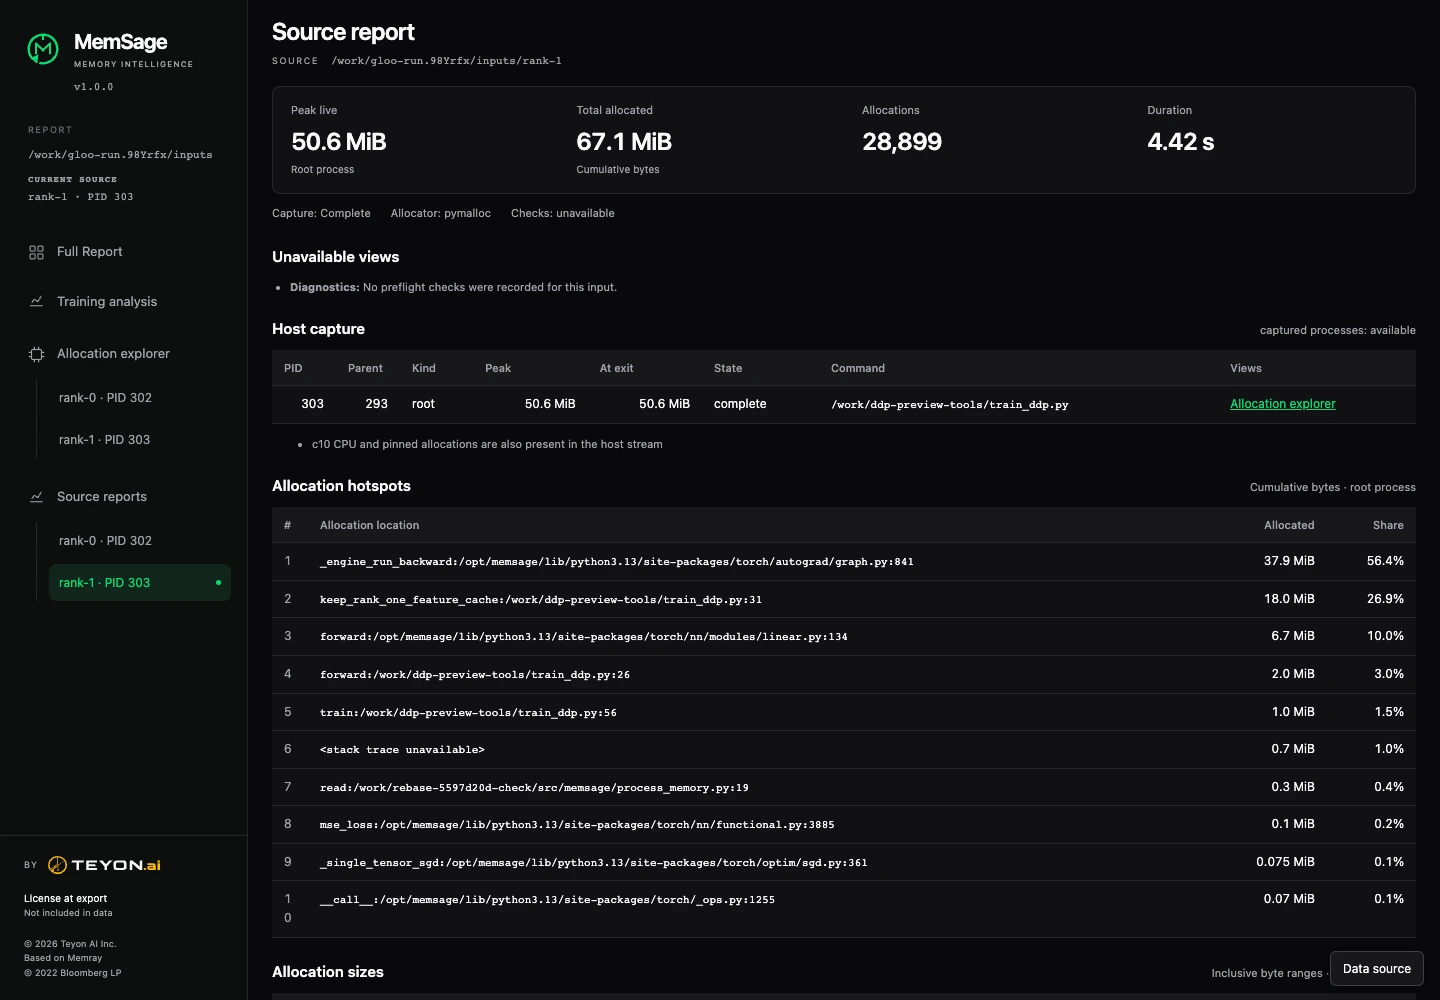
Full Report brings your captures together. Open a source report to inspect its memory peak, allocation hotspots and recorded processes, then move into the matching analysis.
Try this workflow
memsage report rank-0/ rank-1/ \
--site ./reportIn this recorded CPU training example, two rank captures have different allocation peaks. The source report and flame graph identify a feature-cache call site worth investigating.
Recorded example · CPU training
Allocation site in the recorded stack
# train_ddp.py:31
# keep_rank_one_feature_cache
cache.append(features.repeat(12, 1))The rank 1 report attributes 18,913,198 cumulatively allocated bytes to keep_rank_one_feature_cache. Follow that stack to inspect why repeated feature tensors are being appended to the cache.
Values come from the bundled CPU capture, not a GPU benchmark. Cumulative allocations and peak live bytes measure different things. Rank artifacts are inspected independently; their values are not summed.
Use run for ongoing observation, preflight for a short check and complete allocation profile, and report to inspect what was recorded.
01 / Observe
Watch a Python workload or a PyTorch training job while it runs.
Command
memsage run --training \
  --live-port 8080 \
-o capture train.pyA capture directory and a local live page. Training adds step-level CPU/GPU memory readings; a plain Python run records allocations during growth windows.
02 / Investigate
Check a representative training workload and record a detailed profile.
Command
memsage preflight --training \
  --steps 5 \
-o preflight train.pyA preflight directory with check findings, a verdict and a full allocation capture. Use this profile for flame graphs, tables and deeper allocation analysis.
03 / Explore
Turn the capture into an offline report you can inspect in a browser.
Command
memsage report preflight \
--site ./reportOpen report/index.html to explore the available views. The report stays available after the process exits; this command does not start a server.
Export JSON for the MemSage frontend. Open the exported folder through Data source, or mount it with the viewer’s --reports option.
memsage report preflight --site ./report-data --data-onlyCompare compatible full allocation captures before and after a code change.
memsage report after --baseline beforeRead the last recorded state of a process that died from a run or preflight capture.
memsage report capture --postmortemPrint a machine-readable report, or see the options and formats supported by each command.
memsage report capture --json
memsage help report
Examples assume MemSage is installed and output directories are new or empty. Use your own script in place of train.py or app.py. Training, CUDA and cgroup OOM diagnostics require Linux; plain Python profiling also supports macOS.
Product scope, evaluation, and access to the private beta.
MemSage is a CPU and GPU memory diagnostics product for AI training and inference. It helps teams investigate memory usage, leaks, inefficiencies, and out-of-memory failures.
Existing profilers and memory snapshots can provide allocation histories and call stacks. MemSage focuses on connecting memory growth and peaks to relevant allocations, tensors, and call stacks across monitoring, preflight checks, and diagnosis. Evaluate the workflow on your own workload.
Include your framework and versions in your beta request. The team will discuss compatibility and setup for your workload before you begin.
Before running on production workloads, confirm what data is collected, where it is processed and stored, and how access and retention work. Measure overhead against a baseline in your own environment.
MemSage is in private beta. Enter your email to get the download and trial license. You can optionally share your environment and diagnostic goals. Confirm compatibility with the team before setup.
During evaluation, confirm version compatibility, measurement overhead, and data-handling requirements for your environment. Automatic failure recovery belongs to Teyon’s broader platform work and is not part of this MemSage description.